Breeding
Alpaca inbreeding coefficient: explained simply, with a calculator
Timm Quandt9 min read
Before you have a female mated, take a look at the pedigree: if the male and the female are related, so is the cria. The inbreeding coefficient sums this up in a single number. This guide explains what that number means, how Wright’s formula calculates it, how many generations you need for it and how to check a planned mating yourself with the calculator.
Calculate the inbreeding coefficient
Enter the male and the female you want to mate, plus their parents and grandparents as far as you know them. The calculator looks for animals that appear on both sides and uses them to work out the inbreeding coefficient of the planned cria. With the examples you can try out how typical relationships play out.
Enter the sire and dam of the planned cria and, as far as you know them, their parents and grandparents. Identical names count as the same animal; upper and lower case don’t matter.
The calculation only knows the animals you enter (3 generations above the cria). If ancestors are missing, the actual inbreeding coefficient may be higher.
Enter at least the sire and the dam, and the result will appear here.
The calculator runs only in your browser. The names are neither stored nor transmitted.
How the calculator rates the result
There is no official limit for alpacas. The levels in the calculator are therefore based on well-known degrees of relationship and are meant as a guide, not as a rule.
- No common ancestor found: No animal appears on both sides within the generations you entered. That does not mean the male and the female are definitely unrelated.
- Low: below 6.25%, that is below the value of a mating between first cousins. Common ancestors lie further back.
- Notable: from 6.25% up to below 12.5%. This corresponds to at least a mating between first cousins.
- High: from 12.5%, that is at least at the level of a half-sibling mating. Full siblings and parents with their offspring come to 25%.
What the inbreeding coefficient tells you
Every cria inherits two copies of each gene, one from the sire and one from the dam. If the sire and the dam are related, both copies can trace back to the same gene of a common ancestor. Geneticists call such copies identical by descent. The inbreeding coefficient F states how likely this is at any given locus. It was introduced by the American geneticist Sewall Wright in 1922.
A cria with F = 25% is therefore, on average, homozygous at a quarter of its loci for a copy that comes from a common ancestor. A cria from two unrelated parents has F = 0%.
A value relative to the known pedigree
The inbreeding coefficient is always relative to the animals listed in the pedigree. An animal at the very top with no recorded parents counts as unrelated and not inbred in the calculation. A value of 0% therefore means there is no common ancestor in the known pedigree. There may still be one further back.
Typical values
The following values apply when the common ancestors are not inbred themselves. You can reproduce them in the calculator with the examples.
| Mating | Inbreeding coefficient of the cria |
|---|---|
| Full siblings | 25% |
| Parent and offspring | 25% |
| Half siblings | 12.5% |
| Double first cousins (both pairs of parents are siblings) | 12.5% |
| First cousins | 6.25% |
| Half cousins | 3.125% |
| One common ancestor among the great-grandparents of the male and the female | 0.78% |
How Wright’s formula works
For the calculation you look for every path that leads from the sire through a common ancestor to the dam. Each path contributes part of the result:
F = Σ (1/2)^(n1 + n2 + 1) × (1 + F_A)
Here n1 is the number of generations from the sire to the common ancestor, n2 is the number of generations from the dam to that ancestor, and F_A is the inbreeding coefficient of the ancestor itself. The summation sign Σ means the contributions of all paths are added up.
Example: half siblings
The male Cosmo and the female Luna have the same sire, Apollo. From Cosmo to Apollo is one generation, and from Luna to Apollo as well. With n1 = 1 and n2 = 1 you get (1/2)^3 = 1/8, so 12.5%. With full siblings a second path through the shared dam is added, and the two contributions together come to 25%.
When the common ancestor is inbred himself
If Apollo is inbred himself, his own two copies are already identical by descent with a certain probability. Then the copies he passes on to two offspring match even if he gives them different ones. The factor (1 + F_A) accounts for this. An example from an Oklahoma State University fact sheet: a sire who has an inbreeding coefficient of 25% himself is mated to his daughter. Instead of 25%, the calf comes to (1/2)^2 × 1.25 = 31.25%. The calculator takes this into account as long as the ancestor’s parents are in the pedigree.
Paths may not pass through an animal twice
A path only counts if it contains no animal twice, apart from the common ancestor. With full siblings, for example, the grandparents are common ancestors too. Their paths, however, run through the sire or the dam of the siblings and are therefore already counted. By hand this quickly gets confusing with large pedigrees. The calculator uses the relationship matrix (tabular method) for this and lists the contributions of the individual ancestors using the path method. Both methods arrive at the same result.
Why inbreeding matters in alpaca breeding
Inbreeding does not create new genetic defects. But it makes recessive traits that an animal carries unnoticed show up in double dose more often, and then they become visible. The Oklahoma State University fact sheet describes this using cattle as the example. It describes the consequences as well documented for all major livestock species.
The drop in performance caused by inbreeding is called inbreeding depression. An analysis of 154 studies on seven livestock species from 1990 to 2020 found that with every percentage point of pedigree inbreeding, a trait dropped on average (median) by 0.13% of its mean. All kinds of traits were affected, fertility and survival as well as production and conformation. There has been little research on alpacas themselves so far. There is no reason to expect them to be an exception.
The situation in Europe
A genomic study published in 2026 with 179 alpacas from Germany, Austria and Switzerland found genetic diversity similar to that of alpacas from Peru. The authors conclude that breeders in both regions are preserving diversity well. For the population as a whole, that is good news. For your next mating it says little. Whether the male and the female are related is written in their pedigree.
And that is where some names keep cropping up. Well-known herdsires are used by many farms, their offspring are sold and meet again a few generations later on another farm. If you choose a male only for fiber and conformation, you will not see this.
How many generations the pedigree needs
Every ancestor that is not entered counts as unrelated in the calculation. If ancestors are missing, the inbreeding coefficient comes out too low. A paper on genetic evaluation in dairy cattle pointed this out as early as 1992. A study of more than 12,000 alpacas on a Peruvian breeding farm shows it clearly: the average inbreeding coefficient was 0.165%, but the grandparents were known for only 25 to 43% of the animals. The authors consider the depth of the pedigrees itself to be unreliable.
How much a common ancestor contributes depends on how far back it lies. If it appears among the grandparents of both the sire and the dam, it is 3.125%. One generation further, among the great-grandparents of the parents, it is still 0.78%, and one more generation back about 0.2%. On its own that is not much. But if the same male turns up in several lines, the contributions add up.
In practice this means that with three generations above the cria you will reliably spot close relationships. If you know the fourth generation, enter it; the calculator has a checkbox for that. And the more animals in your pedigree are unknown, the more cautiously you should read a low result.
Avoiding inbreeding in practice
In a breeding program, relatedness can rarely be avoided entirely. But you can make sure you know about it before the cria is on its way.
Check the planned mating beforehand
Calculate the inbreeding coefficient before you take the female to the male, not only at birth. Matings between full siblings, half siblings and parents with their offspring are the closest form of inbreeding. The Oklahoma fact sheet advises against mating siblings with each other or parents with their offspring.
Choose the herdsire deliberately
Ask the owner of an outside male for his pedigree, ideally across several generations. Compare it with the lines of your females. A male that suits your females is not automatically the one that won at the last show.
Document lines properly
Record the sire and dam of every animal, including bought-in animals and outside herdsires. Keep the registration papers and enter them while the documents are still at hand. What is missing today often cannot be added a few years from now.
Inbreeding coefficient in ALPAKA.PRO
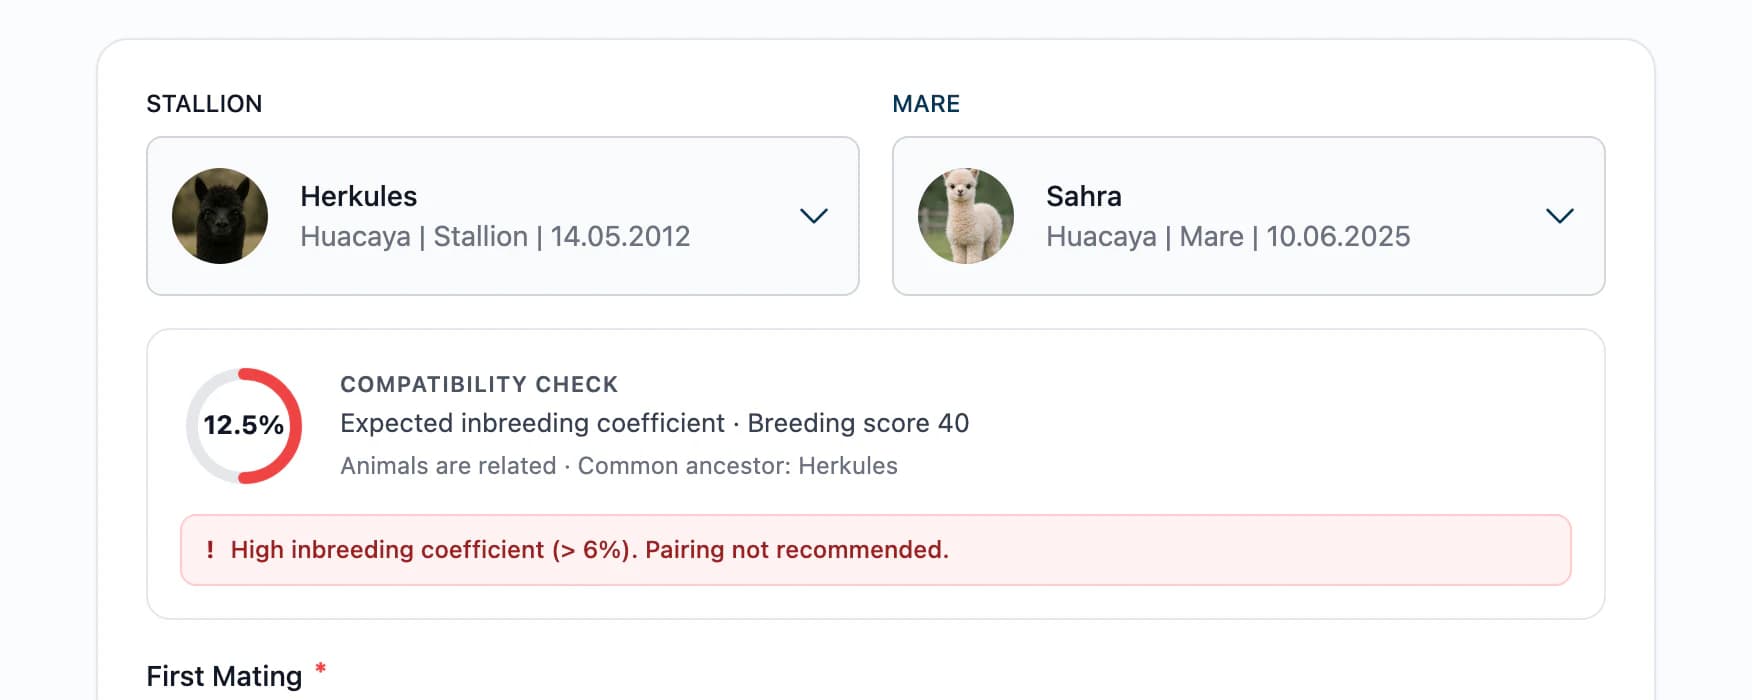
The calculator on this page checks one mating. In the breeding software from ALPAKA.PRO you see the inbreeding coefficient and the relatedness in percent for every planned mating, with the relationship stated, calculated from your animals’ pedigrees. The software shows common ancestors across several generations, and mating suggestions with a traffic light show you which males suit a female. You build pedigrees across several generations, including animals outside your herd, and export them as a PDF or image for buyers and associations.
If your pedigrees are already in Excel or another program, you don’t have to type them in again. You send us the file, and we import animals, pedigrees and health data, usually within a day and free of charge, even during the trial. How it works is explained on the home page under Data import.
Frequently asked questions
What inbreeding coefficient is still acceptable in alpacas?
There is no official limit for alpacas. The lower, the better. The calculator rates values from 6.25% (the level of first cousins) as notable and from 12.5% (the level of half siblings) as high. Matings between full siblings, half siblings or parents and their offspring are considered the closest form of inbreeding in livestock breeding. Mating siblings, or parents with their offspring, is generally not recommended.
How many generations do I need for a meaningful calculation?
With three generations above the cria, that is parents, grandparents and great-grandparents, you will reliably spot close relationships down to half cousins. Common ancestors further back only show up in the calculation if you enter them. Enter as many generations as you know reliably.
Does 0% mean the male and the female are not related?
No. 0% only means that no animal appears on both sides within the generations you entered. The calculation treats every missing ancestor as unrelated. A common ancestor further back therefore stays invisible.
What is the difference between the inbreeding coefficient and relatedness?
Relatedness describes two animals, for example the male and the female. The inbreeding coefficient describes a single animal, here the planned cria. If the parents are not inbred themselves, the cria’s inbreeding coefficient is half the relatedness of its parents: full siblings are 50% related, and their cria has an inbreeding coefficient of 25%.
Can ALPAKA.PRO calculate the inbreeding coefficient for my animals?
Yes. In the breeding module you see the inbreeding coefficient and the relatedness in percent for every planned mating, calculated from your animals’ pedigrees. You can add outside animals directly while planning. If your pedigrees are already in an Excel file, we import them free of charge.
Sources
- Wright, S.: Coefficients of Inbreeding and Relationship. The American Naturalist 56, 330–338 (1922)
- Northcutt, S. L.; Buchanan, D. S.; Clutter, A. C.: Inbreeding in Cattle. Oklahoma Cooperative Extension Service, ANSI-3165
- VanRaden, P. M.: Accounting for Inbreeding and Crossbreeding in Genetic Evaluation of Large Populations. Journal of Dairy Science 75, 3136–3144 (1992)
- Leroy, G.: Inbreeding depression in livestock species: review and meta-analysis. Animal Genetics 45, 618–628 (2014)
- Doekes, H. P.; Bijma, P.; Windig, J. J.: How Depressing Is Inbreeding? A Meta-Analysis of 30 Years of Research on the Effects of Inbreeding in Livestock. Genes 12, 926 (2021)
- Vilela, J.; Asparrin, M.; Montenegro, V.: Assessment of Generation Interval and Inbreeding in a Peruvian Alpaca Population. Proceedings, 10th World Congress of Genetics Applied to Livestock Production (2014)
- Tan, K. et al.: Genome-wide SNP-based genomic diversity and population structure analysis in alpaca populations from Europe and Peru. G3: Genes, Genomes, Genetics 16 (2026)